PRACTICAL 8
Practical 8
AIM:
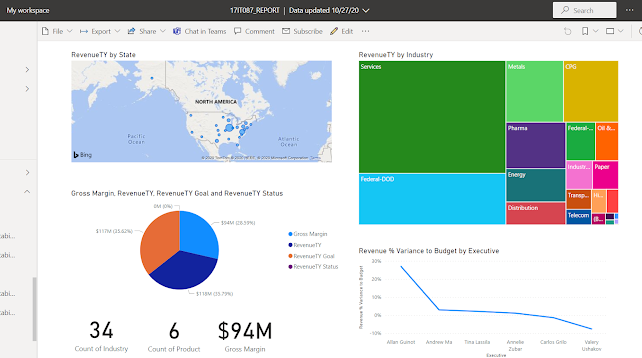
Perform Data Analytics using Power BI using the given dataset. Generate a report that contains various visualizations.
Power BI reports are essentially graphics that help describe the dataset. A report could just be a single visual or pages of visuals.
What is Power BI Report Builder?
Power BI Report Builder is a tool for authoring paginated reports that you can publish to the Power BI service. When you design a paginated report, you're creating a report definition that specifies what data to retrieve, where to get it, and how to display it. When you run the report, the report processor takes the report definition you have specified, retrieves the data, and combines it with the report layout to generate the report. You preview your report in Report Builder. Then publish your report to the Power BI service.
Designing Reports
A well-designed report conveys information that leads to action. Identify the questions that the report helps to answer. Keep those questions in mind as you design the report.
To design effective data visualizations, think about how to display information that is easy for the report user to understand. Choose a data region that is a good match for the data that you want to visualize. For example, a chart effectively conveys summary and aggregated information better than a table that spans many pages of detailed information. You can visualize data from a dataset in any data region, which includes charts, maps, indicators, sparklines, data bars, and tabular data in various grid layouts based on a tablix.
The primary purpose of report parameters is to filter data at the data source, and retrieve just what is needed for the purpose of the report.
For report parameters, find a balance between enabling interactivity and helping a user get the results they want. For example, you can set default values for a parameter to values that you know are popular.
Steps to generate Report:
- Before you can create any reports in Power BI, you need a dataset for this, So I am going to use sample dataset provided by Power BI.
- In my case, I used Customer Profitability Sample.
- After successfully adding dataset, Click on your dataset to create a new report. Now you can see a blank canvas.
- Now you have to add visuals to your report, and there are two ways to achieve that:
- Select the fields first then visualizations after
- Or if you have the specific visualization in mind, select the type of visual first then the fields after.
Selecting the map icon in visualizations pane and selecting Revenue TY and State to get a visual.


Comments
Post a Comment